
An empirical investigation of how competition shapes firms’ innovation incentives using stock market–based patent valuations.
Introduction
It’s a common perception to think of competition as a primary catalyst for innovation and, by extension, economic growth. As firms engage in “head-to-head” rivalry to secure market share, or in some cases ensure survival, the development of new technologies becomes a strategic necessity. Theoretically, innovation allows firms to differentiate their offerings, capture larger market segments, and ultimately boost profitability. Based on this intuition, the greater the anticipated economic value of an innovation, the stronger the incentive for firms to invest in R&D. Consequently, it is often assumed that the economic value of innovation is highest in intensely competitive industries.
However, the relationship between market structure and innovation is not strictly linear. Economic literature identifies two primary, competing schools of thought regarding whether competition enhances or diminishes the value of innovation.
The escape-competition theory, with roots in the work of economists like Kenneth Arrow, argues that intense competition makes a successful patent more valuable for two key reasons:
- Higher Profit Margin: In highly competitive industries, profit margins are thin. A new patent grants a firm a temporary monopoly or a strongly differentiated position, allowing it to escape competition and capture significant economic rents.
- Easier to Capture Market Share: Markets with intense competition often feature products that are very similar and easily substitutable. A breakthrough patent allows a firm to offer something truly novel, making it much easier to capture market share from rivals. This translates directly into more substantial future cash flows and a higher economic value for the patent.
Conversely, imitation risk argument suggests that intense competition can erode the incentives to innovate. In environments with many rivals, firms may quickly imitate or replicate an invention, thereby dissipating the pioneer firm’s competitive advantage and reducing the innovation’s economic value. Beyond mere imitation, competitors may race to develop their own “follow-on” inventions, making the original innovation obsolete much faster.
Further research developed by Scherer (1967) allowed non-monotonicity in this relationship, revealing an “inverted-U” shape relationship between competition intensity and incentive to innovate. As illustrated in fig. 1, this model suggests that the returns on innovation are maximised at moderate levels of competition. At the extremes—either perfect competition or total monopoly—the incentives to innovate tend to diminish.

Figure 1: The figure from The Quarterly Journal of Economics 120, no. 2 (2005): 701-728, titled “Competition and innovation: An inverted-U relationship,” plots a measure of competition on the x-axis against citation-weighted patents on the y-axis. Each point represents an industry-year.
Our primary objective with this article is to disentangle these confounding mechanisms and isolate the direct impact of competition on the economic value of innovation, and hence, firms’ incentives to innovate. In order to determine causality, one would need to compare a patent’s value against an identical patent held by the same firm in a different competitive landscape. As this ideal experiment is not feasible, we approximate the condition by comparing similar patents granted just before and just after likely-anti-competitive events (i.e., horizontal M&A).
We examine “likely-anti-competitive events” by studying horizontal mergers and acquisitions (where the two companies are in the same industry). Our method involves comparing the value of patents granted to the merging companies against those granted to their non-merging competitors. We look at two periods: the 35 days leading up to the merger announcement (excluding the immediate 7 days before) and the 35 days following it (again, excluding the first week).
To conduct this comparison, we first need a measure of innovation that captures the firm’s underlying incentive to innovate.
Measuring Innovation
The literature on competition and innovation has primarily relied on metrics such as citation-weighted patent counts, equity returns on R&D expenditure, or their industry-level aggregates. However, our study shifts the focus to the economic value firms derive from their innovations, as this value represents the primary incentive for firms to innovate. Since competition can directly affect this expected return, it plays a central role in shaping innovation incentives.
To capture the economic value of innovation (different from its scientific value), we use the stock market-based patent value measure developed by Kogan (2017). This measure isolates the stock market’s reaction to the patent grant, reflecting the discounted future cash flows associated with the new patent; therefore can be used as a good proxy for the financial incentive that drives economic innovation.
ξj,t = 1Ni,t 11 − pE[vi,t | Ri,t] (1)
In this specification, ξⱼ,ₜ represents the estimated private economic value of patent j granted on day t; Nᵢ,ₜ is the total number of patents granted to firm i on day t; p is the unconditional probability of a patent application being granted, vᵢ,ₜ signifies the innovation shock; Rᵢ,ₜ is the firm’s stock return on the grant date; and E[vᵢ,ₜ|Rᵢ,ₜ] denotes the expected value of the innovation given the observed market reaction.
While it’s possible that market-based measures can be subject to short-term noise or potential misvaluation, the event study method is widely recognized in financial economics for its ability to capture investor expectations about future cash flows.
Measuring Competition
The industry level competition, which is our explanatory variable, referred to a given year, is calculated as one minus the sales-weighted average markup:
Competitions,t = 1 − ∑i∈sSalesi,t∑i∈sSalesi,t · Markupi,t (2)
Where i, s, and t denote the firm, industry and year, respectively; Competitionₛ,ₜ is the industry-level competition measure, using Text-based Network Industry Classifications (TNIC), a firm is considered part of the focal firm’s industry if it has a positive similarity score; Salesᵢ,ₜ represents the firm’s total sales.
Markupi,t = Operating Profiti,t − Financial Costi,tSalesi,t (3)
Markupᵢ,ₜ is the price-cost margin calculated following Aghion (2005) as the difference between operating profit and financial costs divided by total sales.
We employ the markup as it’s widely used as an empirical proxy to reflect the market power of a firm or industry; in essence, it captures the firm’s ability to charge a price above its marginal cost.
Data Sample
Based on the groundwork of Muhan Hu, Linxiang Ma (2026). We take as sample all patents granted to US public firms between 1986 and 2020.
To analyze the impact of M&A we consider all deals where the form of the deal is coded as merger, an acquisition if the acquirer owns less than 50% of the target before the bid and more than 90% upon the deal completion, then classify a deal as a horizontal merger if the acquirer and the target operate in the same Standard Industrial Classification (SIC) industry.
All dollar amounts are adjusted for inflation and expressed in constant 1996 U.S. dollars.
Empirical Analysis
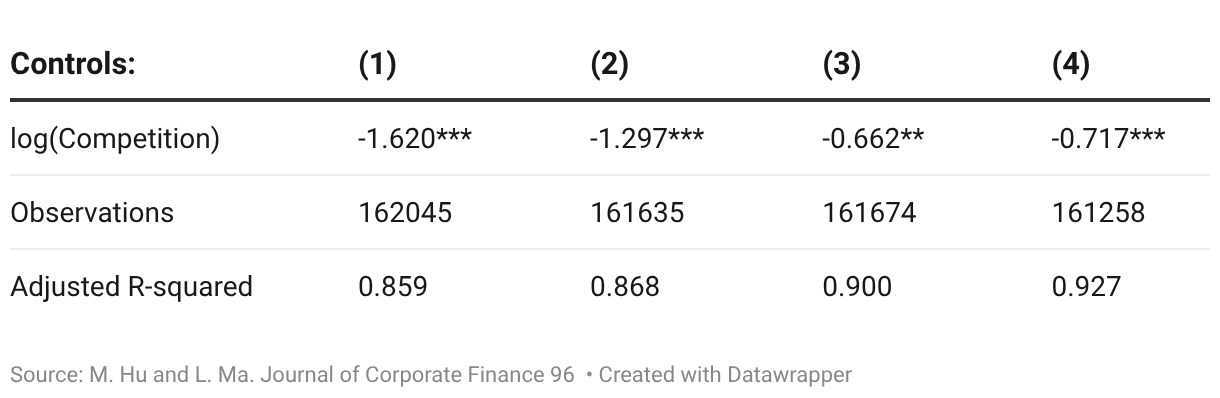
We proceed to investigate the relationship between competition and patent value using an OLS regression model:
log(Patent Valueijst) = αi + β log(Competitionst) + γXijst + δjt + κtm + ϵijst (4)
where i, j, s, t, m indicate index firm, patent, industry, patent-granting year, and patent-granting month, respectively. We use the log transformation to mitigate the impact of extreme patent values. Since Competitionₛₜ is not easy to interpret immediately, we use the natural logarithm to give our estimated coefficient a percentage interpretation.
Xᵢⱼₛₜ is a vector of firm-level control variables that may influence both competition and patent value, thereby addressing potential omitted variable bias. Specifically, we control for:
- Log total assets: Firm size as a proxy for scale and resource availability
- Leverage: Capital structure that may affect R&D investment capacity
- Return on assets (ROA): Profitability that influences innovation spending
- Market-to-book ratio: Growth opportunities and market valuation
- Research intensity: R&D expenditure scaled by sales
- Institutional ownership: Governance and investment horizon effects
We also include αᵢ (firm fixed effects) to account for time-invariant firm-level unobserved heterogeneity, δⱼₜ (industry-year fixed effects) to control for technological trends and industry-specific shocks, and κₜₘ (year-month fixed effects) for systematic macroeconomic shocks that affect all firms. Standard errors are clustered at the industry and year levels to account for potential correlation of residuals within industries and over time.
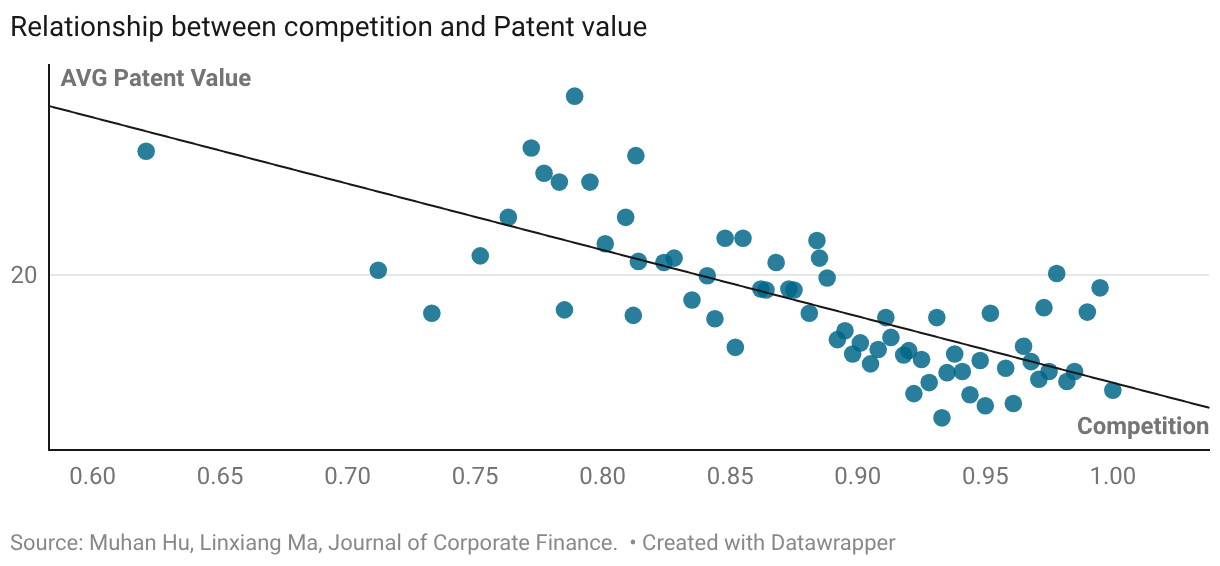
A preliminary visual analysis in fig. 2 suggests a negative relationship. A binned scatter plot of patent value against our competition measure reveals a clear downward-sloping pattern, indicating that higher levels of competition are associated with lower patent values.
While the graphical evidence is intuitive, it cannot account for other important determinants of patent value nor address underlying endogeneity concerns. We therefore employ a regression model to control for confounding factors and better isolate the relationship of interest.
0 Comments
Be the first to leave a comment.